#1. 121% NRR from 10+ seat customers, 107% overall, ~85% from smallest customers.
A super-helpful breakdown. 65% of its revenue comes from 10+ seat deals and they have 121% NRR. NRR is likely around 85% for self-service and < 10 seat deals (about the same as Squarespace). pic.twitter.com/2J0D8kNPoT
— Jason ✨BeKind✨ Lemkin ⚫️ (@jasonlk) May 22, 2021
A curious thing happened on the way to SaaS in 2021+. Everyone seemingly became an expert in churn.
Your churn rate should be 0.123909% per month. It should be net negative. You need to retain 118% of your revenue. Etcetera, etcetera. You will get a lot of advice here.
Most of these insights are directionally accurate, but here’s the thing. Churn is not a GAAP metric. It doesn’t have a universal definition. In fact, Christoph Janz had a great post a ways back noting how even public companies define churn differently. And even hide it in part, by doing so. Read it here:
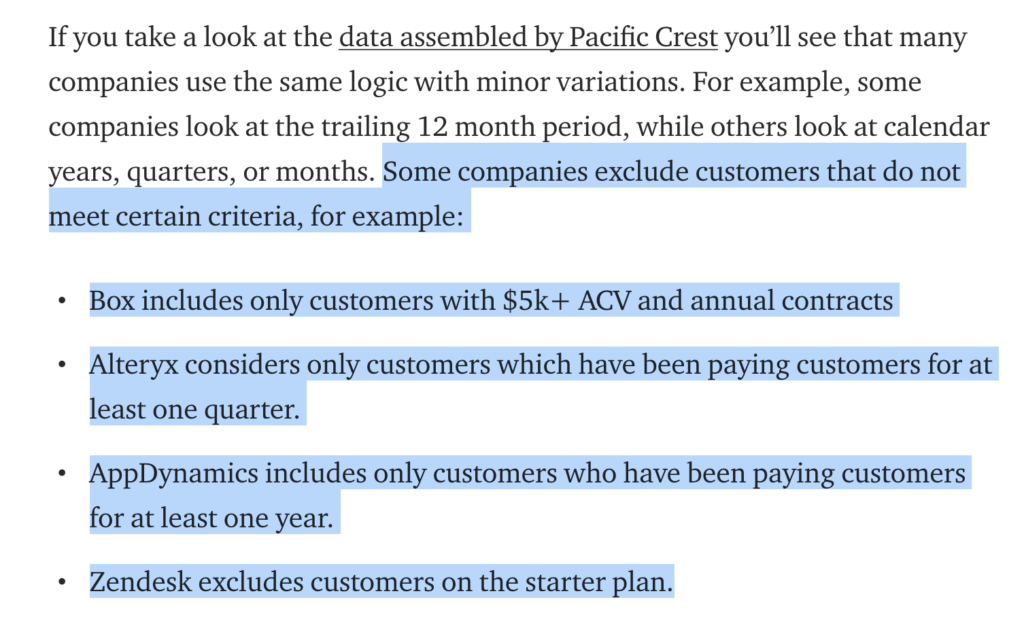
I learned this myself starting out as a SaaS CEO. I compared us to the only public company in our space, back in the day, and noted a curious thing. This public company did break out churn in their public documents (not every company does). But they excluded churn in the first 60 days. Why? Their answer: because it was a trial period, and they felt churn there did not represent long-turn churn risk. But also, part of the answer I am sure is that churn was much higher in the first 60 days. 🙂
In any event, what I learned from that was to segment churn. I quickly segmented our churn into three segments:
- Single-seat and deals < $99/month. We had about 3% a month churn here measured by revenue. They turned over fairly quickly, as credit cards expired, jobs changed, etc. Even today, I see many “solopreneur” businesses churning at about 3% a month. Single person businesses. They just … go under. A lot more often than Fortune 500 companies do, that’s for sure.
- $99-$999/month deals. These “credit” card deals had about 100% net revenue retention, for us, after churn. Turns out, this is pretty similar to Hubspot, for example. And Zendesk. And so many others in this zone.
- $10k-$100k+ and up deals. These deals had about 120% net revenue retention. Turns out, this is a lot like other B2B SaaS companies that sell to the enterprise. See Box’s bigger customers, Salesforce, etc.
As time went on, we expanded the size of each category (our “Big” Deals went from $12k a year to $120k a year and beyond). But the segmentation, and metrics, were roughly similar.
Churn should be naturally higher in smaller business segments than larger ones. If you don’t segment it — no one will see that. Also, if you don’t segment churn, it will likely look higher with bigger customers than it really is. And you will be trying to attack different churn problems with the same answers. Keeping big customers happy really is different than keeping small businesses from seeking a cheaper tool.
And just see where the money goes. Even if churn is higher than you’d like based on certain metrics, if at the end of the day, you retain a lot of the money, that’s maybe fine.
And if you want to exclude trials and POCs from churn, that’s OK too. Just don’t call them recurring revenue if you exclude it. Segment them out as a POC/trial revenue, and don’t count the deals as part of your core MRR/ARR until the trial/POC ends and converts. Churn is often much lower if you segment POCs and trials from post-trial revenue.
Whatever you do, and however you do it, segment churn and track the money.
And also segment NPS and CSAT as well per segment. NPS and CSAT also often vary widely by segment. Double down on the happiest segments, usually. And the segments growing the fastest.
You will see new things, and new patterns.
And maybe — it’s not as bad as you think. Or at least different than you think. Blended churn metrics only confuse things. Big companies will stay for years if you provide them a true solution. But individual and small customers … well … even if they are very happy, they will come and go.
(note: an updated SaaStr Classic post)