By Benton Nilson, LeadGenius
How fast are your qualified leads turning into closed deals?
It’s a deceptively simple question.
When measuring the overall growth trajectory of your business, reviewing individual marketing and sales metrics, such as inbound lead count or MQL-to-SQL conversion rate, all add up to tell a story of where you are headed. But, if you needed to pick a single metric to benchmark growth, sales velocity can give you a sense of the big picture.
The standard sales velocity equation contains 4 variables: average deal size, number of opportunities, conversion rate and sales cycle length. Sales velocity is not a perfect metric, but it does effectively combine key metrics from both marketing and sales into one calculation. By keeping an eye on your sales velocity, you can gauge the effectiveness of your overall selling process, starting from marketing hand-off all the way to the sales team closing deals.
You know your product. You know your go-to-market strategy. You should also know your sales velocity.
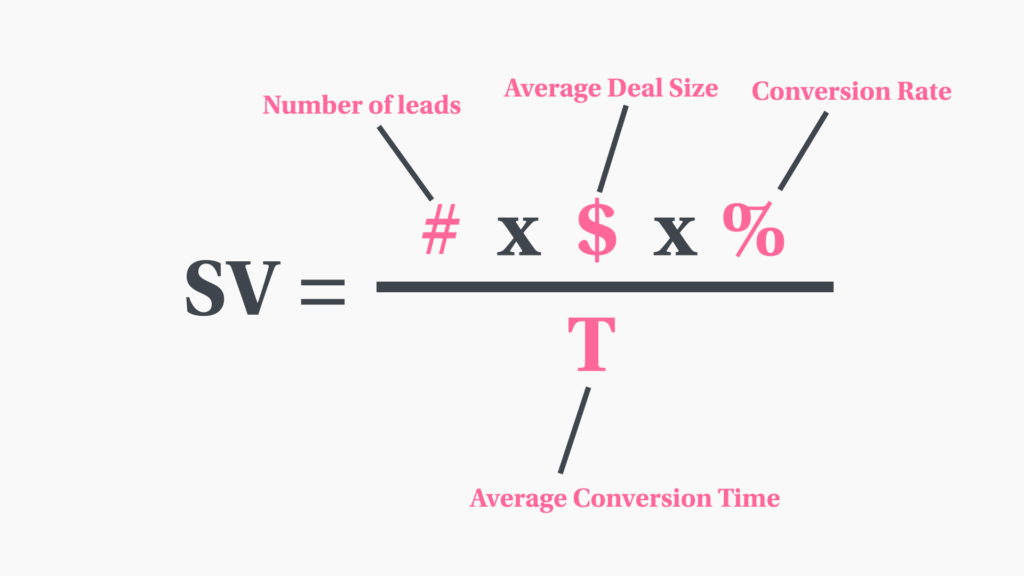
Sales velocity is calculated with 4 common marketing and sales metrics. Of course, the more accurate these numbers, the more accurate your results.
- # – Number of leads
- $ – Average deal size
- % – Lead to closed/won conversion rate
- T – Average conversion time
If these numbers are not readily available to pull from your CRM, realistic estimates based on historical numbers, or industry averages can fill in for now. The important thing is to get started.
MQL Count
A steady pipeline of qualified leads is the fuel of your marketing and sales engine.
Having accurate, reliable, and consistent top-of-pipeline data enables you to accurately test targeting and messaging in a systematic manner. As John Kelly of eBay points out, a quota carrying rep’s greatest priority at any given time is to have a steady flow of reliable leads to ensure the pipeline won’t dry up.
On the other hand, increasing lead volume without maintaining quality will cause inefficiencies and threatens to increase the length of the the sales cycle. A boom of inbound leads from a marketing campaign might seem like a blessing, but sifting through all of them to separate the wheat from the chaff takes extra time and will ultimately drag down the efficiency of your already busy sales reps.
Lead quality heavily affects the other three variables in the sales velocity equation.
Average Deal Size
Average deal size is the dollar figure generated by a closed deal. Customer lifetime value (CLV or LTV) can also be used.
Bigger average deal size means more revenue, so why not just focus on getting the bigger deals?
Going after bigger contracts means you’ll need to close fewer of them to reach your goals. However, bigger deals take longer close. The total addressable market for increased deal size may be smaller; they often involve more decision makers, budget approval, more product marketing support, customers service, etc.
Bigger deals are sometimes better, but not always. Speed counts and so does conversion rate.
Sales Cycle Length
Average conversion time is the length in days it takes for the sales team to take an open opportunity and convert it to a closed deal.
Sales cycle length depends on many factors: overall sales efficiency, marketing-sales alignment, product-market fit, product quality, pricing, product complexity, and more.
Sales efficiency correlates with the average deal size. Smaller deals will close faster, as there are usually fewer decision makers involved, but the deal size will typically be smaller.
Timing, for example, is another factor that determines whether the client is ready to make an investment. Someone with a budget to spend will convert faster than someone who does not have immediate mandates. Being ready with the right solutions when the customer is experiencing the pain will place you in the best position to close a deal.
MQL to Close/Won Conversion Rate
MQL to Close/Won conversion rate is the percentage of qualified leads that end up becoming paying customers.
This number will reflect not only the sales team’s ability to close deals efficiently, but may also point to the qualification process. Qualifying more leads into the funnel will bring up your number of opportunities, but potential consequences will be felt in the conversion rate. The less qualified the leads are in the beginning, the less likely they will end up closing.
—
After you’ve collected the data to fill in the variables, or formed educated guesses, just tap into your middle school algebra and plug in the variables. The resulting number will be your Sales Velocity in a dollar amount. Plot this value month-over-month to see the trend.
For many, the sales velocity equation is a wake up call that simply increasing lead volume is not everything. Having lots of opportunities in the pipeline may look good for marketing, but without a strong conversion rate, the overall results will be falling short. The sales velocity equation can then prime the sometimes necessary process of reducing lead volume and renewing focus on lead quality.
Sales velocity shouldn’t be looked at simply as a standalone stat. It is also largely a trailing indicator. That being said, sales velocity can help you anticipate future lulls in revenue. The equation’s true use comes as an litmus test of where your overall revenue team is heading.
The result of using this formula to inform your strategy can be surprising: you can actually do more with less, and other times, if you’re not careful, you can end up doing less with more.
Benton Nilson is a videographer and content specialist at LeadGenius, a trusted enterprise solution for high-quality lead generation and go-to-market insights.