It’s a challenging time to be a marketer. People are more anxious and distracted than ever, and it’s increasingly difficult to connect with audiences in a memorable way that makes them feel emotionally connected to your brand. That’s where data storytelling helps cut through the noise.
Jessica Gilmartin, Head of Revenue Marketing at Asana, a leading work management platform, shares learnings from her tried-and-tested experiments with data storytelling.

Why data storytelling should be part of your marketing strategy
Data stories are memorable. According to a Harvard business school study, data storytelling is compelling because it simultaneously engages many aspects of your brain—language comprehension, emotional response, and empathy. A few key features of data storytelling are:
- Data storytelling links your product to a business challenge. It shows how your product might address challenges that people deeply care about.
- Data storytelling credibly shapes external narratives. It helps you shape your brand narrative according to what’s happening worldwide.
- Data storytelling builds revenue-driving assets. It lets you create a high-quality treasure trove of marketing material that you can use to drive leads and revenue.
“Data storytelling is telling impactful, emotional stories that connect with your customers using powerful data.”
Three data points in action in Asana’s data storytelling
Asana conducted an Anatomy of Work Survey with 13,000+ knowledge workers from seven countries. Let’s analyze the three notable data points from the study that Asana used to move customers through the data funnel.
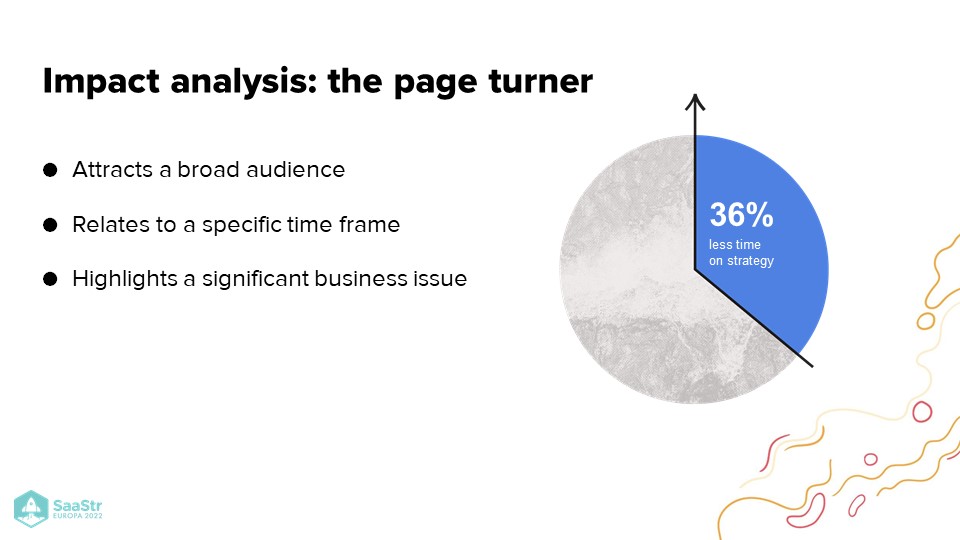
1. Employees are spending 36% less time on strategy this year than the previous year.
The first data point; it’s called The Page Turner. It compels the reader to ask questions. Before you offer your brand as a solution, your potential customers must ask questions. Relevant data storytelling can highlight those questions.
- The Page Turner attracts a broad audience. Many people prefer to spend more time on strategy and less on execution.
- It’s related to a specific time frame. We can all remember that we’ve spent less time on strategy in the last couple of years, and the time spent has reduced with every subsequent year.
- It highlights a business issue. It lets you imagine a world where your team could spend more time on strategy and how it could positively impact your business.
Asana leveraged this data point on a landing page. It prompted website visitors to wonder why they were spending less time on strategy than before. Then they want to learn more!
The brand illustrated that people spend less time on strategy and more time on lower-level work with data visualization and animations. Asana gained thousands of email addresses for interested prospects they could use to engage with at the right time.

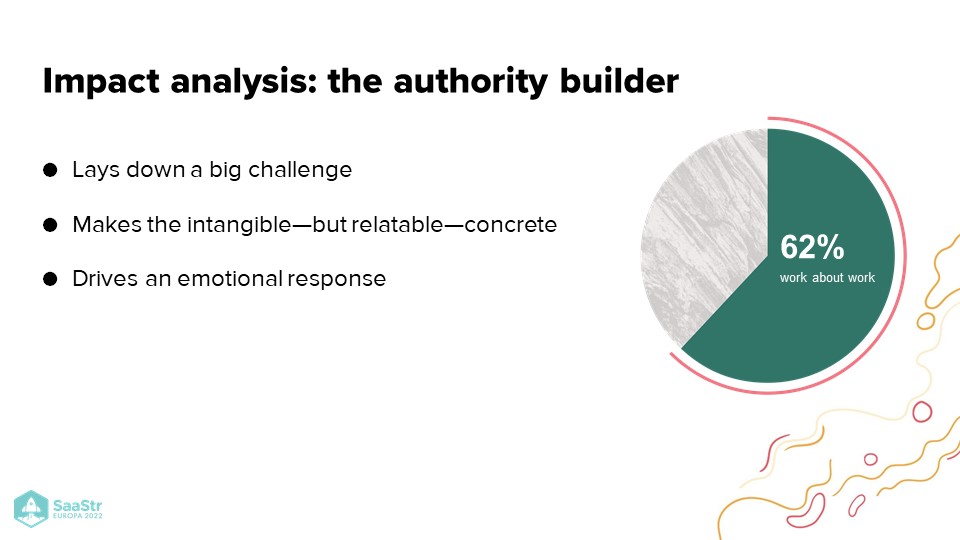
2. Managers lose 62% of their workdays to low-impact work.
Managers lose two-thirds of their workday to low-impact work. Low-impact work includes tasks like tracking status updates or going to unnecessary meetings—things we all have to do at work but hate doing. This data point is called The Authority Builder because it makes a very intangible thing that we’ve all felt more concrete.
“Data storytelling enables you to name a pain that customers have, build a connection, and show them you are a partner and not just a vendor.”
- The Authority Builder lays down a big challenge. Data lays out everything you’re doing that’s wasting your time.
- It makes the intangible-but-relatable more tangible. We all know we spend too much time on busy work. The statistic reinforces that.
- It drives an emotional response. Everyone knows how demoralizing it is to work on stuff that isn’t meaningful.
Asana set up a partnership network with leading professors and experts in fields like economics, neuroscience, and organizational behavior. The company ran dozens of webinars and roundtables with these experts to discuss low-impact work and provide solutions. Gilmartin claims these webinars have been the most attended and engaging events they’ve ever run.
Since Asana leaders host these events, the credibility of these experts is conferred upon the brand.

3. The average worker loses 129 hours each year to meetings.
Most workers lose an equivalent of three weeks attending meetings which are often unnecessary. This is a data point that does more than raise eyebrows. It makes the news. This data point is called The Story Conflict. It makes consumers recognize an essential part of their work life as a potential issue and take action.
- The Story Conflict hones in on a specific newsworthy issue. It helps users see a problem for what it is and start asking questions. Meetings are the problem in this case.
- It showcases impact at scale. People recognize it as a serious problem.
- It begs follow-up questions (and resolutions). Potential users start looking for answers to this problem.
Asana nurtured its relationship with sales teams by giving them impact-driven data to use further down in the revenue funnel. With these statistics built into outreach emails, infographics, and other sales materials, they could highlight them to sales prospects.
This is powerful in later-stage conversations of converting leads to opportunities by positioning the product as the solution.

Top Takeaways
To unlock the power of data stories to drive revenue, you must:
- Grab attention. Use data visualization to raise questions, don’t just answer them immediately.
- Build authority. Partner with experts to build credibility, tell that story with you, and claim your seat at the table.
- Resolve conflicts and convert. Give your sales and marketing teams a toolset to win customers by resolving your data story conflicts. Move people from intention to action by positioning your product as the answer to consumers’ problems.

